
Non-Destructive Testing of Concrete in Practice
A concrete surface rarely reveals what is going on inside the element. Honeycombing from a poorly compacted pour, air pockets behind formwork, a tendon duct that never got properly grouted, reinforcement slowly eaten by corrosion — the conditions that determine how long a structure will last develop where nobody can see them. Non-destructive testing exists precisely to close that gap: it lets engineers characterize the interior of concrete without coring, cutting, or demolishing anything.
This guide covers the method families an inspection engineer actually works with, the defects each one is aimed at, and the practical trade-offs that shape method selection on real projects. Ultrasonic tomography gets the deepest treatment here, because it has become the standard way to build volumetric images of concrete from one face. Every method description below reflects how these instruments behave in the field — on bridge decks, massive foundations, post-tensioned slabs, and calibrated reference blocks such as those at the BAM test site in Horstwalde, Germany.
At Delta Test Technologies we work with the full ultrasonic range every day: single-channel UPVT instruments for velocity-based screening, single- and multi-channel pulse-echo flaw detectors for thickness and reflector location, and FMC/TFM tomography platforms for true volumetric imaging. The distinctions drawn in this article are the same ones our specialists use when advising bridge owners, dam operators, and inspection contractors on which technology fits their inspection program.
What this article covers
- Why NDT of aging infrastructure has become unavoidable
- A compact taxonomy of the method families
- A defect-by-defect map, matched to the methods that detect each one
- How UPVT and ultrasonic pulse-echo tomography differ in physics and output
- Where GPR, electrochemical, and other methods belong in the mix
- A practical framework for choosing the right method
- Equipment categories and what distinguishes a professional tomography system
1. Why NDT Has Become Mandatory for Concrete Infrastructure
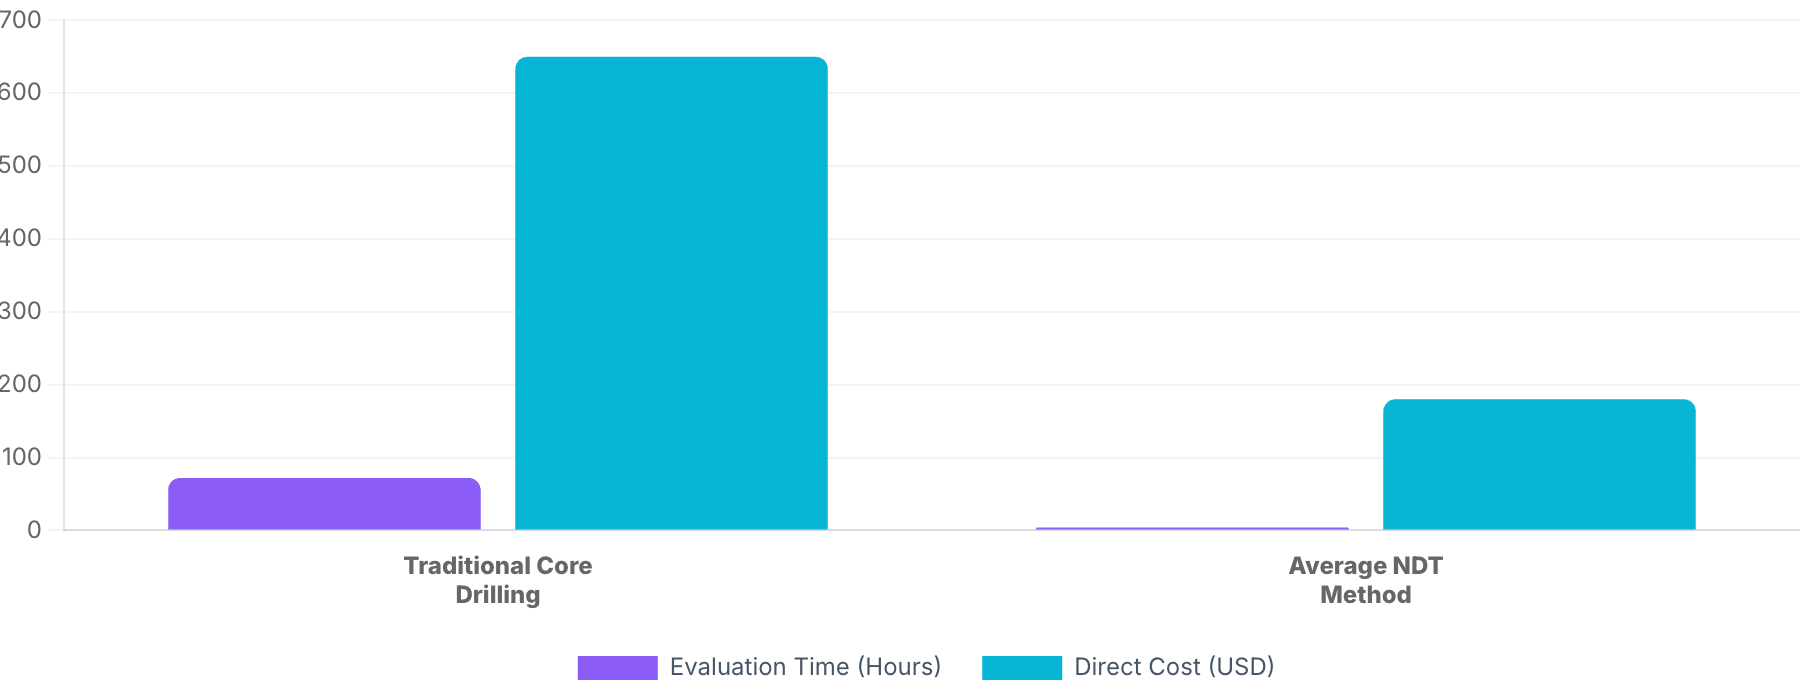
A large share of the world’s concrete stock — bridges, dams, tunnels, containment structures, highway decks — was built between the 1950s and the 1980s. Those structures have reached or exceeded their original design lives. The open question is no longer whether they need inspection, but how quickly and how accurately engineers can determine what is happening inside them.
The financial argument carries itself. A repair triggered by visible spalling or a failed load test — the reactive kind — costs roughly three to five times what planned, NDT-guided maintenance costs. Finding a delamination or a voided tendon duct early turns a targeted local repair into the plan, instead of a lane closure followed by structural retrofit.
Expectations from owners and contracts have tightened in parallel. Concrete NDT does not operate under the kind of prescriptive recertification regime that governs weld inspection in steel structures, but asset owners, infrastructure operators, and rehabilitation programs increasingly demand documented condition data accumulated over time: structured inspection records, repeatable procedures, traceable instruments. Even where no formal mandate exists, the pressure to produce defensible, reproducible reports is real.
Access to instrumentation is widening as well. Next to outright purchase, advanced ultrasonic arrays are increasingly obtainable through rental, inspection-as-a-service contracts, and equipment leases. That converts a six-figure capital decision into a per-project operating expense and puts the same instrumentation used by large inspection contractors within reach of smaller engineering firms and municipal agencies.
The bottom line remains: no single NDT method handles the full spectrum of concrete inspection tasks. Modern inspection is multi-modal, and selecting the right method is the engineer’s central skill.
2. The NDT Landscape at a Glance
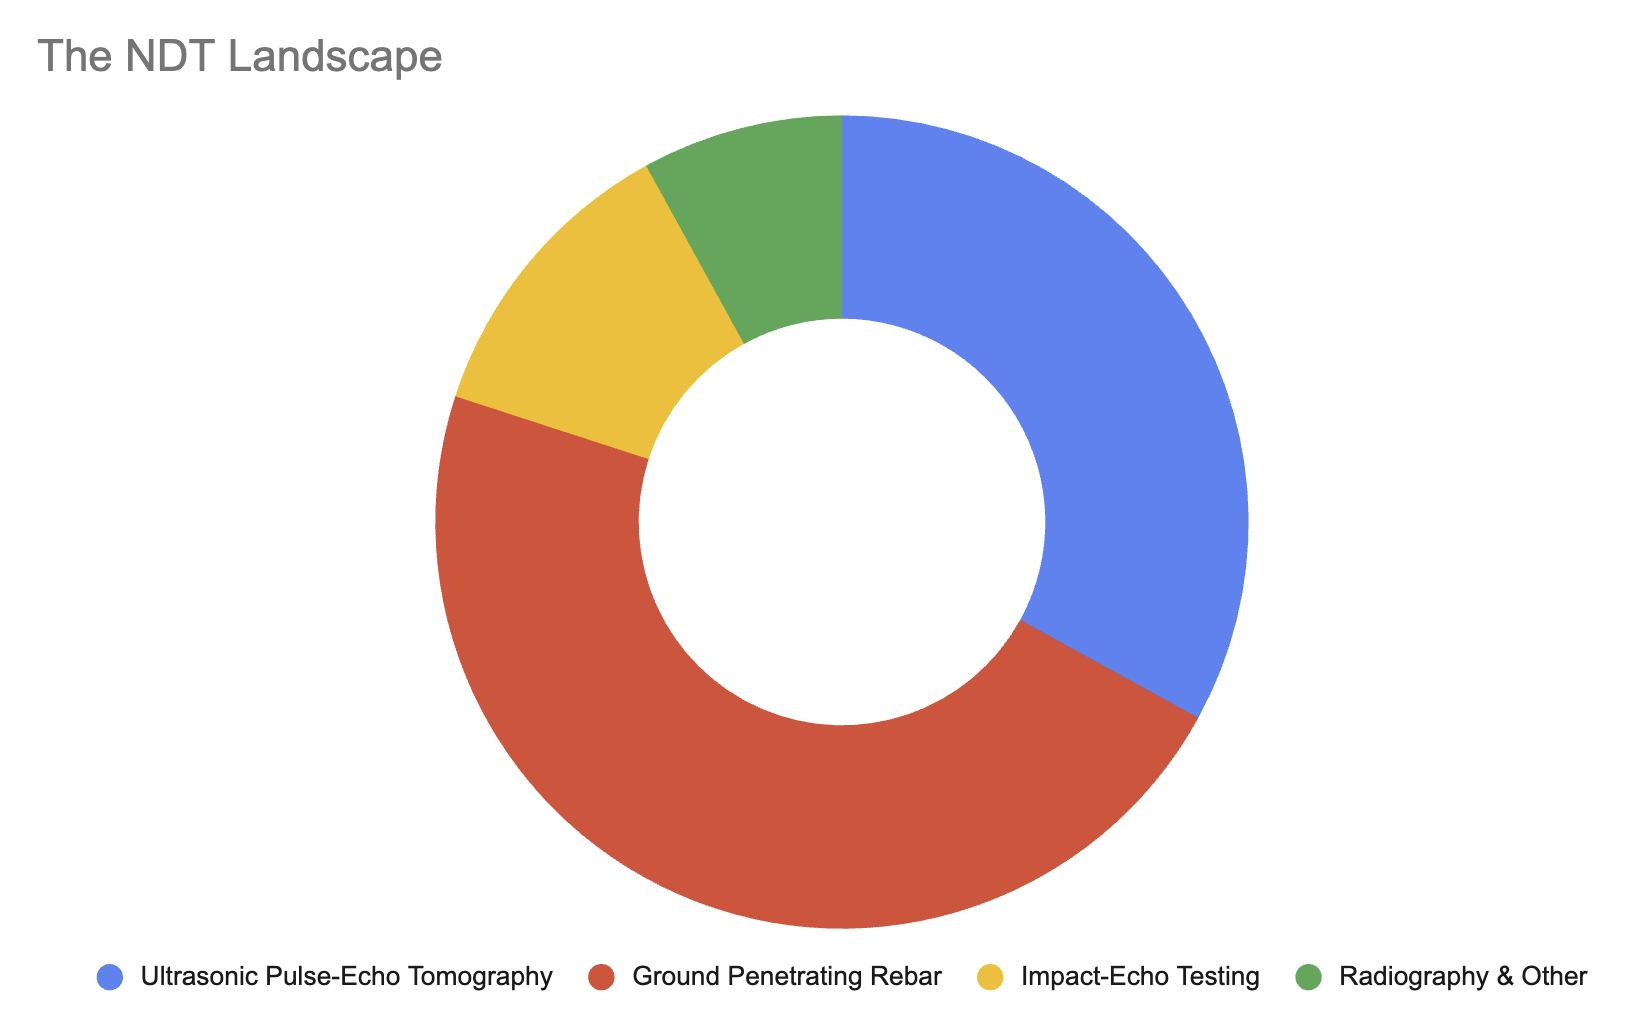
Concrete NDT methods fall into several families, each grounded in different physics and each with its own diagnostic window.
- Mechanical and surface hardness.
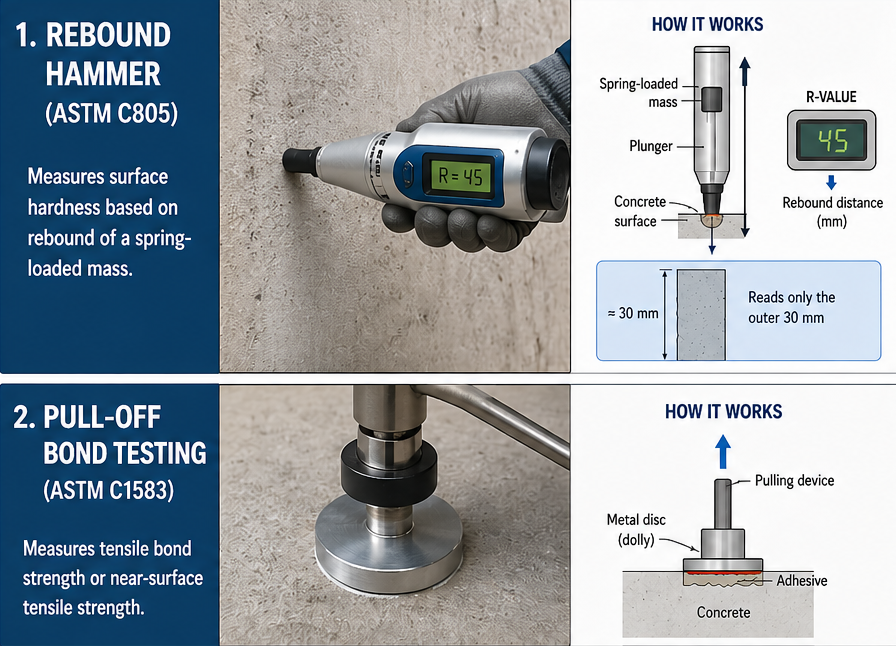
Rebound hammers and pull-off testers probe the outer 30 mm of the concrete surface. Fast, portable, and suited to relative comparisons rather than absolute strength values.
- Acoustic (low-frequency stress-wave methods).
The Impact-Echo method uses a mechanical strike plus frequency analysis to detect thickness changes and large-scale voids from a single face.
- Ultrasonic.
Three distinct branches live here. The Ultrasonic Pulse Velocity Test (UPVT) is a one-channel, velocity-based method that measures transit time through concrete to classify quality. The Ultrasonic Pulse-Echo Test (UPET) is a single-sided method that locates discrete reflectors — reinforcement bars, anchors, tendons, and material voids — from time-of-flight along a single beam path. Ultrasonic tomography is the advanced form of UPET: multi-channel arrays operating from one side produce 2D and 3D images of the concrete interior. Different methodology, different output, different use cases.
- Electromagnetic and radar.
Ground-penetrating radar (GPR) in pulsed and stepped-frequency variants, plus electromagnetic cover meters. Strong for locating metal (rebar, conduits, tendon ducts), weaker on concrete defects such as cracks and honeycombing. In field practice, GPR is among the most widely deployed concrete NDT techniques on bridge decks and parking structures thanks to its scanning speed and easy single-sided use. Ultrasonic tomography complements it where defect imaging and depth resolution are required.
- Electrochemical.
Half-cell potential mapping, surface resistivity, and connectionless pulse-response devices. These diagnose the corrosion state of rebar, not concrete defects.
- Radiographic, thermal, and passive.
X-ray and gamma radiography, infrared thermography, and acoustic emission monitoring. Each covers a narrow application window and brings specific operational constraints.
Understanding the families is half the picture. The other half is understanding what you are trying to find inside the concrete, because the defect dictates the method choice — never the other way around.
3. What NDT of Concrete Is Actually Looking For
Construction-Stage Defects
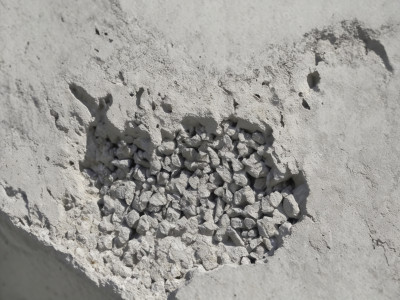
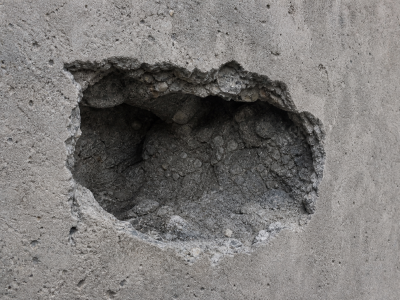
Honeycombing. Loosely compacted zones where coarse aggregate sits exposed with no paste fill. These zones cause a sharp drop in acoustic impedance, which makes them visible to ultrasonic tomography. GPR can flag them through a dielectric anomaly, though with less certainty in dry conditions.
Internal voids and cavities. Air-filled pockets, blowholes behind formwork, cavities left by trapped water. The concrete-to-air interface reflects nearly 100% of ultrasonic energy, so ultrasonic tomography picks these up reliably. GPR struggles with dry voids because the dielectric contrast between dry air and dry concrete is low.
Cold joints and poor compaction. Interfacial weaknesses from pour discontinuities, delayed vibration, or layered placement. UPVT, ultrasonic tomography, and Impact-Echo all detect them, each with a different depth reach and resolution.
Inadequate cover. Rebar positioned closer to the surface than the design requires. Cover meters are the standard QC tool. GPR provides a second opinion and can map cover depth over large areas.
In-Service Degradation
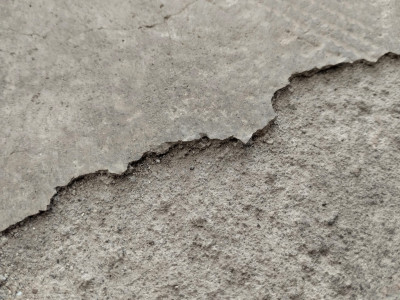
Delaminations. Horizontal separation planes that typically develop beneath bridge-deck wearing surfaces or at repair-layer interfaces. Ultrasonic tomography and Impact-Echo are the definitive detection tools. Infrared thermography flags shallow delaminations when surface temperature differentials are strong enough.
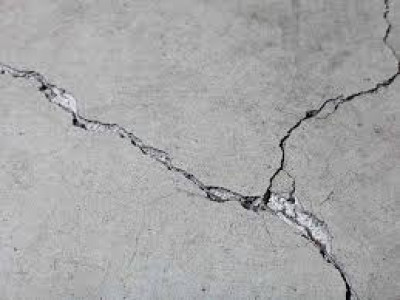
Surface-opening and internal cracks. Surface cracks are mapped visually. Crack depth — the dimension that matters for structural assessment — can be measured with ultrasonic tomography using diffraction signals from the crack tip (see Section 5c).
Carbonation front. The pH drop caused by CO₂ ingress is measured directly with phenolphthalein indicator on core samples. NDT’s contribution here is indirect: resistivity mapping can identify at-risk zones where carbonation is likely advancing.
Freeze-thaw damage. Micro-cracking and surface scaling from cyclic freeze-thaw exposure. A decline in UPVT velocity is a reliable indicator. Resistivity shifts supply supporting evidence.
Reinforcement and Embedded Elements
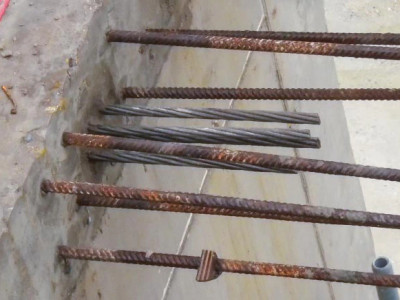
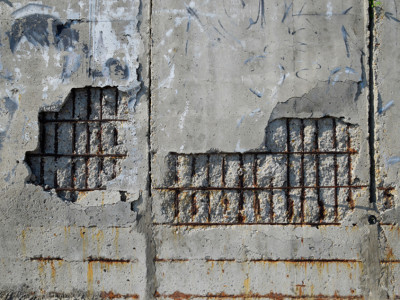
Rebar location, spacing, diameter, and depth. GPR is the primary tool for rebar mapping. Cover meters handle shallow QC checks. Ultrasonic tomography confirms the first, second, and deeper reinforcement mats, especially where GPR signals become congested in dense rebar grids.
Active rebar corrosion. Half-cell potential mapping gives the thermodynamic probability that corrosion is active. Surface resistivity measures the kinetics (corrosion rate). Connectionless pulse-response devices combine both measurements without drilling down to the rebar.
Post-tensioning tendon ducts. GPR locates duct position and orientation. Ultrasonic tomography handles what GPR cannot see: grouting defects, air voids inside the duct, and broken tendons.
Embedded pipes and conduits. GPR finds the target. Ultrasonic tomography confirms depth and resolves material behind dense reinforcement where GPR reflections pile up.
Geometric and Interface Conditions

Element thickness and backwall condition. Impact-Echo and ultrasonic tomography both operate from a single face. Tomography delivers a full image of the backwall profile rather than just a thickness number.
Overlay and repair-layer bond. Pull-off testing measures tensile bond strength at individual test points. IR thermography screens for shallow debonding. Ultrasonic tomography detects deeper interface defects and images the bond plane directly.
4. Mechanical and Surface Hardness
Mechanical methods are some of the oldest tools in the concrete inspector’s kit. They test the surface or near-surface layer and are best treated as screening tools rather than definitive diagnostic instruments.
Rebound hammer. A spring-loaded mass strikes a plunger against the concrete surface, and the rebound distance is recorded as an R-value. Digital variants measure impact velocity directly. The test reads only the outer 30 mm. Carbonation of the surface paste can inflate the R-value by up to 50%. Moisture content also affects results. Rebound testing is useful for uniformity mapping across a structure — flagging zones that differ from the average. It is not reliable for determining absolute compressive strength from a single location.
Pull-off bond testing. A metal disc is bonded to the surface and pulled to failure under controlled tension. The result is a direct measure of tensile bond or near-surface tensile strength. Useful for evaluating overlay adhesion and repair-layer bond. Each test point suffers localized damage.
SONREB combination. Combining rebound data with UPV readings improves the correlation with compressive strength significantly. Neither measurement alone is definitive, but fusing both narrows the uncertainty envelope. This combined approach is well established in structural assessment campaigns.
Mechanical methods are useful for what they are — fast triage of the surface layer — but they stop at roughly 30 mm and they do not see inside the element. For anything deeper, the workhorse family is ultrasonics.
5. Ultrasonic Methods
Ultrasonics is the backbone of modern concrete NDT. This section covers three distinct ultrasonic families — UPVT, single-channel UPET pulse-echo flaw detection, and multi-channel ultrasonic pulse-echo tomography — plus the Impact-Echo technique for context. The three ultrasonic approaches rest on different methodical foundations and produce fundamentally different outputs. They complement one another, but they are not directly interchangeable.
5a. UPVT: Ultrasonic Pulse Velocity Test
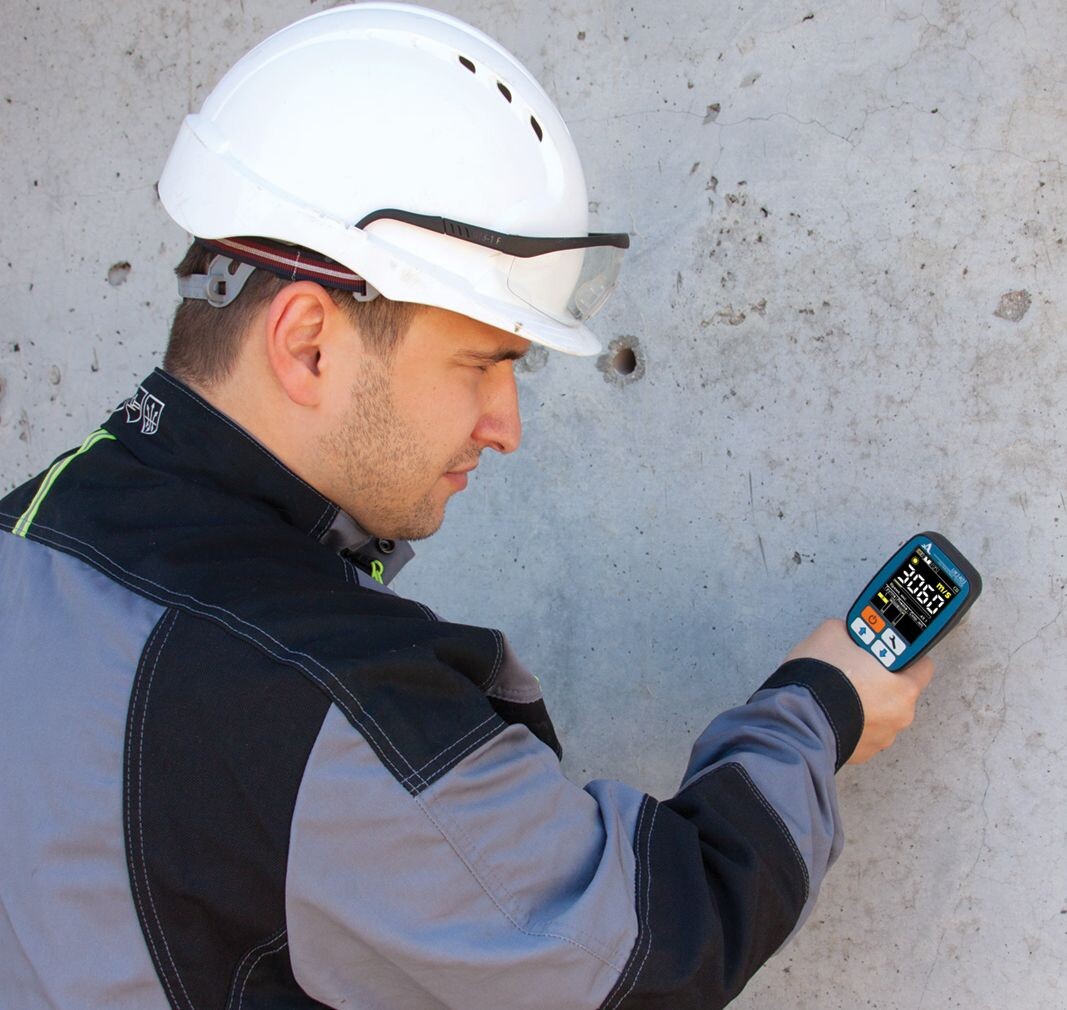
UPVT is the simplest of the three ultrasonic families. It is a single-channel, velocity-based method that has been in use for decades, and it remains a valuable first-pass screening tool for concrete quality.
How it works. A transmitter sends a longitudinal (P-wave) pulse into the concrete. A receiver captures the arrival, and the instrument records the transit time. Velocity is calculated as V = L / t, where L is the path length and t is the transit time [3].
Sensor configuration. UPVT can operate from two sides (direct, through-transmission) or from one side (indirect transmission). Direct mode gives the most reliable readings. Indirect mode is used where only one face is accessible, though its readings are only relevant for near-surface areas.
Once you have a transit time, the measured velocity maps directly to concrete condition. The standard ranges used in practice are:
| Velocity | Quality | Notes |
|---|---|---|
| > 4,500 m/s | Excellent | Dense, sound concrete |
| 3,500–4,500 m/s | Good | Acceptable for most service |
| 3,000–3,500 m/s | Questionable | Investigate further |
| < 3,000 m/s | Poor | Likely deterioration |
These ranges help classify concrete quality and reveal zones of deterioration, poor compaction, or internal cracking.
UPVT has one well-known failure mode worth flagging: the rebar short-circuit effect. When a transducer lines up with a continuous reinforcing bar, the pulse travels along the steel at a higher velocity than through the surrounding concrete [7]. The result is a misleadingly fast reading that can mask a genuinely weak zone, which is why UPVT readings taken near heavy reinforcement demand careful interpretation.
All of this makes UPVT what it is today — a fast screening tool for uniformity and quality mapping across large structures. It tells you that something is off in a zone, but it does not image the defect, locate it in three dimensions, or characterize its shape. For that you need tomography, the next branch of the family. Modern couplant-free instruments such as the UK1401 Surfer make this screening step practical on rough, as-found concrete without surface preparation.
5b. Ultrasonic Pulse-Echo Flaw Detectors (single-channel)
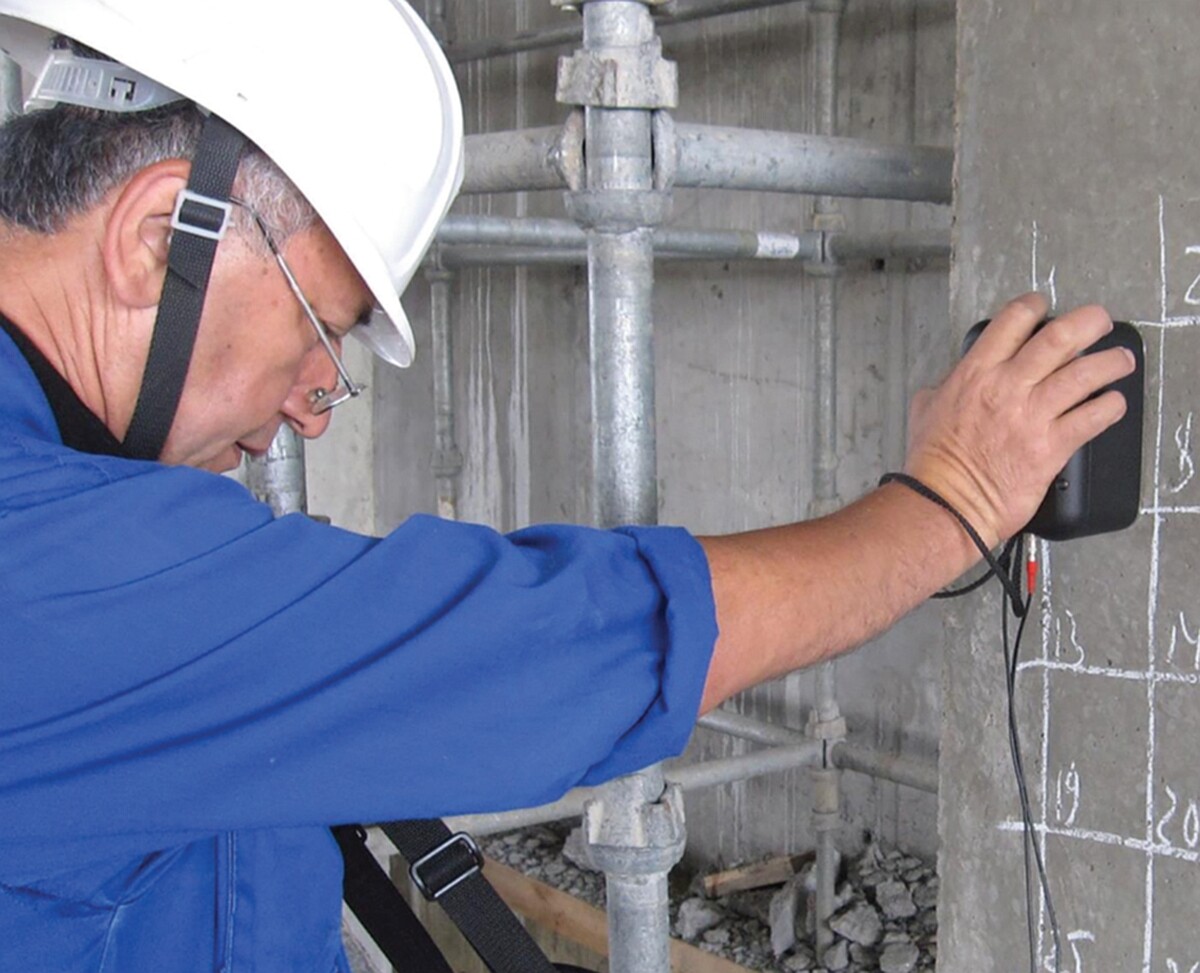
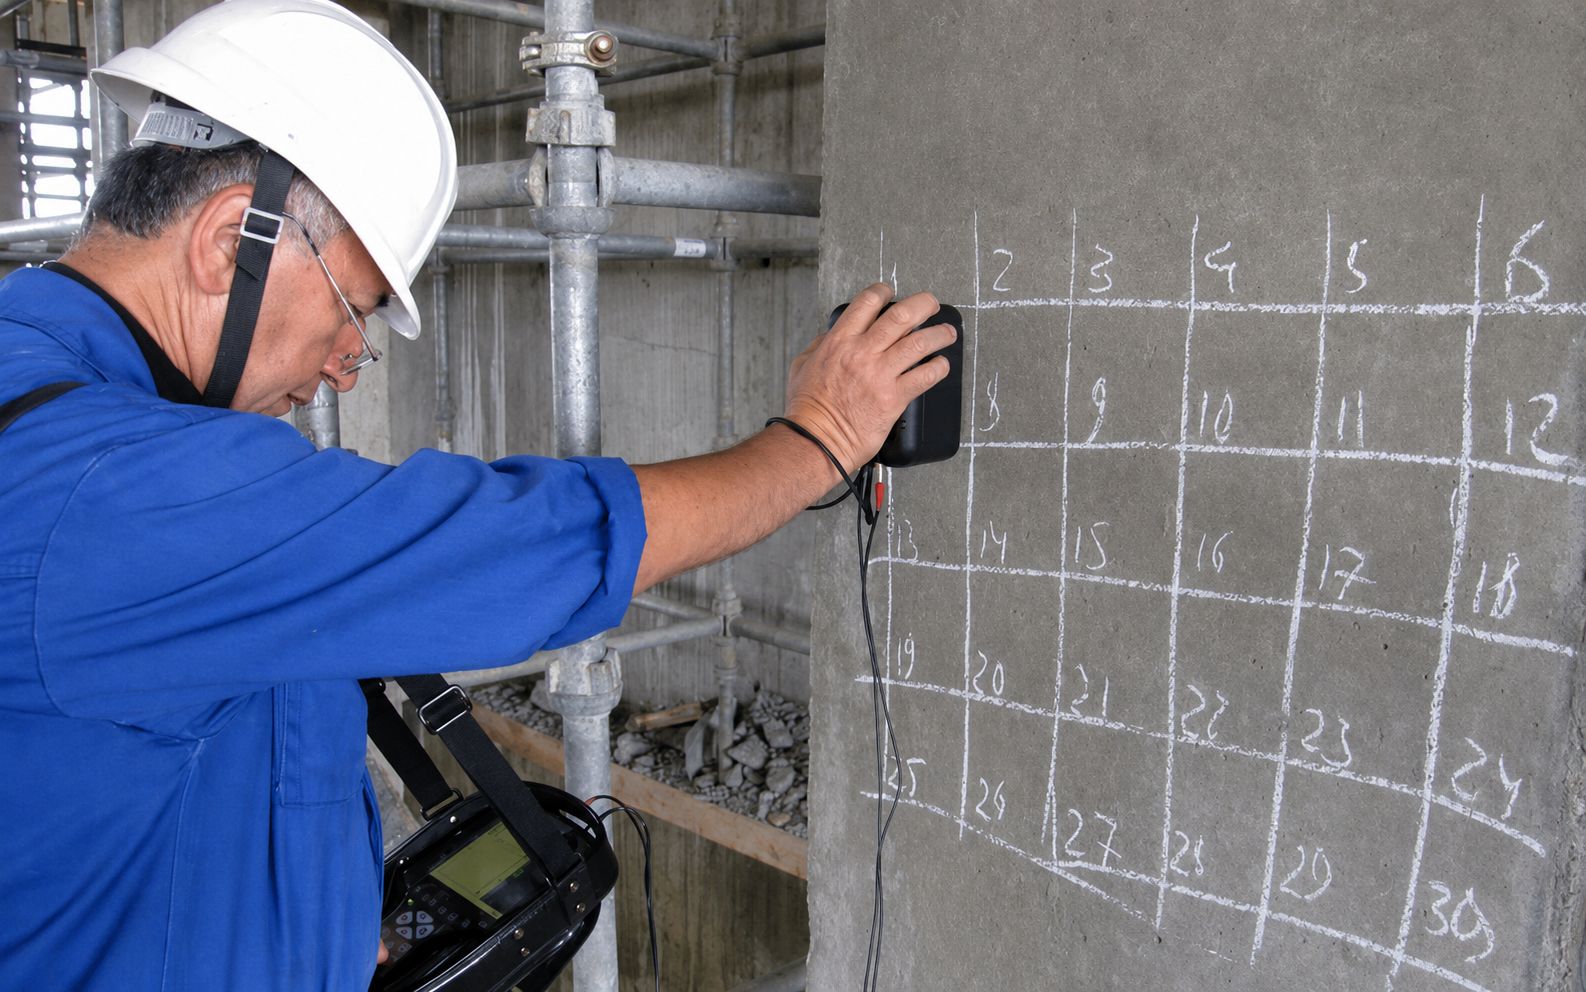
Pulse-echo flaw detection sits between UPVT and tomography in performance. It is a single-sided ultrasonic method that pre-dates tomography and remains the right tool for many targeted thickness and flaw checks where a full volumetric image is unnecessary.
The physics belongs to the same family as tomography but uses a smaller aperture. A short ultrasonic pulse is transmitted into the concrete from a single transducer or a compact array. The signal propagates through the material, reflects off any acoustic-impedance change it meets, and returns to the receiver. The instrument records the time of flight and the amplitude of each echo, and the operator reads element thickness, backwall depth, or the position of an internal reflector directly from the A-scan.
Compared with UPVT, pulse-echo is single-sided and locates discrete reflectors rather than measuring bulk velocity. Compared with ultrasonic tomography, it is a single-channel, one-beam-path method — but it deploys faster, costs less, and suits thickness gauging on slabs and walls, anchor and bolt inspection, and confirming the presence or absence of a single defect at a known location. Paired with external data-processing software, synthetic-aperture reconstruction and 3D imaging can be produced, though that is a rather time-consuming procedure.
Instruments built for this job, such as the A1220 Monolith 3D, are the everyday choice for these targeted single-sided measurements — including anchor and bolt testing of the kind the A1221 Anchor platform is dedicated to.
5c. Ultrasonic Pulse-Echo Tomography (multi-channel)
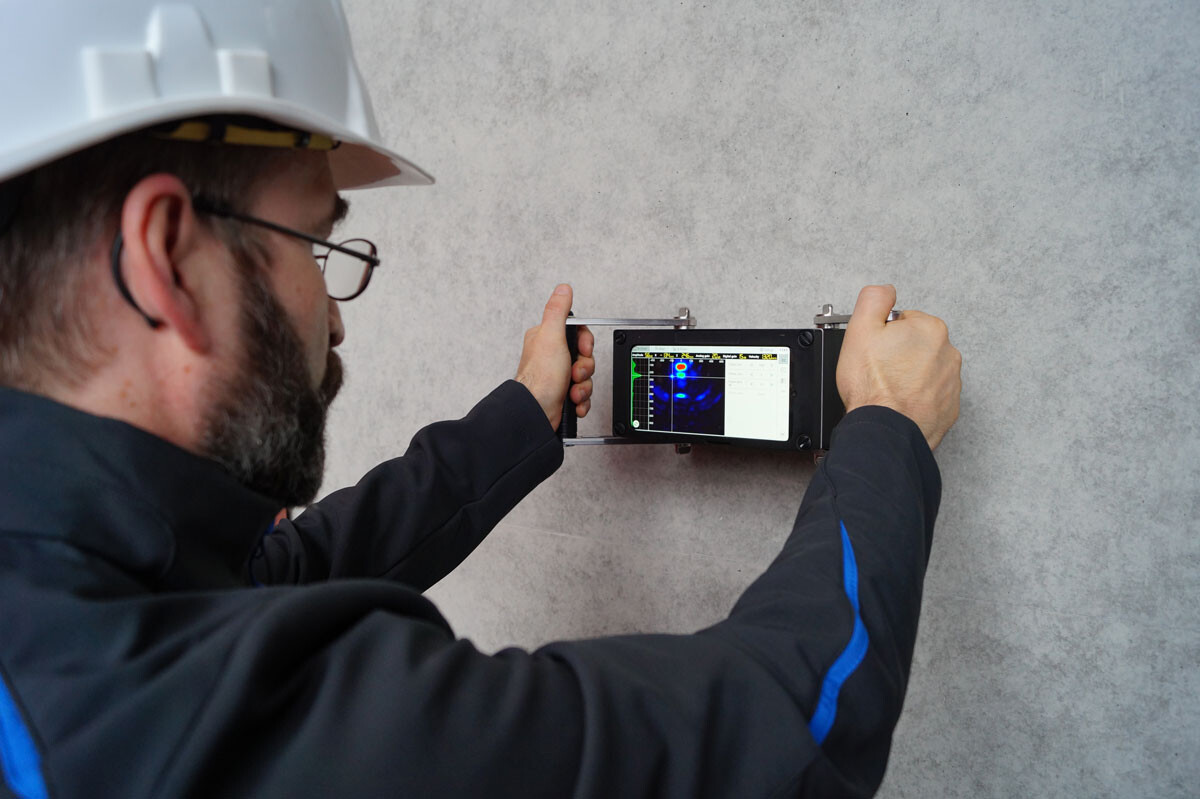
Ultrasonic tomography is the more advanced branch. It is a multi-channel, imaging-based method that needs only single-sided access.
Three things separate tomography from UPVT at the physics level. First, it uses shear (transverse) waves instead of longitudinal ones. Shear waves at the relevant low frequencies let the aperture be reconstructed into a 3D image with the wavelength matched to the coarse-aggregate scale of the cement matrix [4][5]. Second, the operating frequency sits between roughly 20 and 100 kHz: the wavelength must be larger than the coarse aggregate to avoid destructive scattering, while below 20 kHz resolution drops and above 100 kHz aggregate scattering destroys the signal [4]. Third, the sensors are Dry-Point-Contact (DPC) transducers — spring-loaded ceramic tips with integrated transmitter and receiver electronics that couple directly to rough, as-found concrete without gel, water, or any couplant preparation [6]. You place the sensor, press, and measure.
The data processing is what makes the imaging possible. A typical tomography aperture is a 4 × 8 matrix of 32 DPC elements, and data follows the Full Matrix Capture (FMC) principle: each element fires individually while all 32 receive, producing 32 × 32 = 1,024 transmitter-receiver combinations at every measurement position. Those raw A-scans are then reconstructed with the Total Focusing Method (TFM), a variant of SAFT (Synthetic Aperture Focusing Technique), into a true 3D volume of the concrete beneath the sensor [1][2]. A single position yields a three-dimensional voxel data set; scanning along a line produces panoramic B-scans and D-scans; scanning in a grid produces area C-scans and full volumetric data sets that can be sliced, zoomed, and scrolled in any plane, with ISO surface rendering, Maximum Intensity Projection, texture mapping, and gated volume MIP all available [2].
Depth reach scales in two ways. Coupling multiple tomography units into one synchronized matrix extends the aperture from 32 to 64 to 96 to 128 DPC elements, which enlarges the near-field and pushes the depth of focus deeper: about 2 m with a single head, about 4 m with an extended aperture [2]. Beyond 4 m — into dam walls and massive foundations — a modulated excitation sequence replaces the standard short pulse, suppressing quantization and thermal noise over long sound paths. The technique was validated on a 5 m reference block at the BAM test facility in Horstwalde, Germany, where standard excitation could not resolve the backwall but pulse compression produced a clear result [1][2].
One useful side effect of the small DPC elements: their broad beam directivity captures diffraction signals from the tip of surface-opening cracks, which lets the system measure crack depth directly without insonifying the crack face. The measurement needs equal numbers of sensors on either side of the crack, and crack depth cannot exceed the overall aperture size [1][2]. Hilbert envelope processing runs throughout the pipeline to lift signal-to-noise in the reconstructed tomograms.
Put together, this is what tomography localizes inside concrete: multiple rebar layers, post-tensioning tendon ducts and grouting defects inside them, embedded pipes and conduits, honeycombs, internal air voids, delaminations, surface-opening cracks with their depth, and backwall depth and condition. A tomograph can also measure pulse velocity from the same time-of-flight data, but using it for that is like using a CT scanner to take a temperature — the instrument does far more. The A1040 MIRA 3D is the reference instrument in this class.
It has limits worth being honest about. Dense dual-mat rebar casts acoustic shadows that degrade imaging behind the multiple mat. There is a near-field dead zone in the first 25 to 50 mm from the surface. Static contact is required, which makes scanning slower than rolling a GPR antenna. Warm asphalt overlays dissipate shear-wave energy. And scan planning plus result interpretation still depend on operator skill.
5d. Impact-Echo
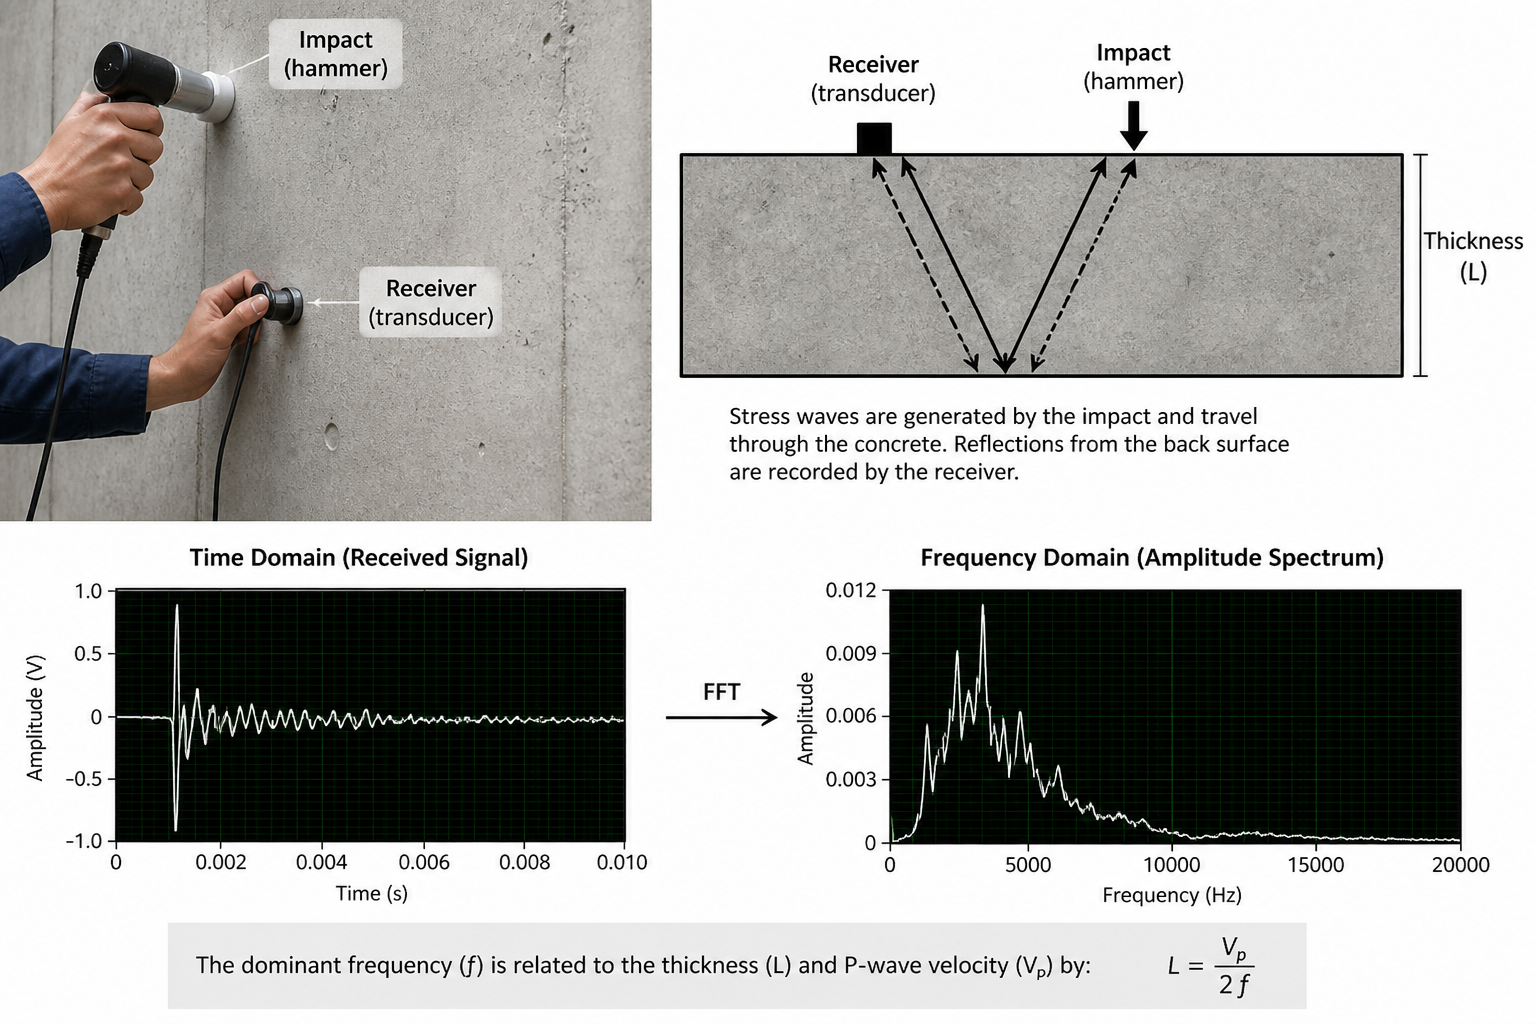
Impact-Echo is a single-sided acoustic method that appears frequently in bridge and slab inspections. It occupies a different niche than ultrasonic tomography, and understanding both helps you pick the right tool.
The physics is simple. A mechanical impactor strikes the surface and generates stress waves. A sensor next to the impact point records the response, FFT converts the time-domain signal into resonant frequencies, and the dominant frequency maps to element thickness or delamination depth.
Impact-Echo earns its place on mass concrete elements, slab thickness verification, and deep horizontal delaminations. The trade-off is that it is a single-point measurement — one spot at a time with no imaging — so a manual workflow limits throughput. The impactor diameter controls frequency content and depth range, meaning operator choices directly affect results. And Impact-Echo does not image defect shape; it gives a pass/fail indication per point. For volumetric defect mapping, ultrasonic tomography is the more complete tool.
6. Electromagnetic and Radar Methods
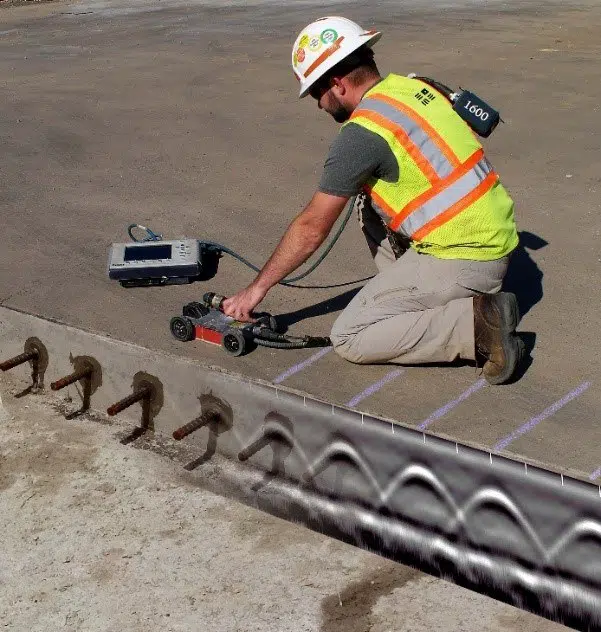
GPR is a well-established technology and a frequent companion to ultrasonic methods. It deserves fair treatment, including an honest look at where it falls short.
GPR fundamentals. GPR works on dielectric contrast. An antenna transmits an electromagnetic pulse into the concrete. Reflections occur at interfaces where dielectric properties change — most notably at rebar, conduits, and other metallic embedments. Rebar and conduits produce characteristic hyperbolic signatures. The depth-versus-resolution trade-off depends on antenna frequency: lower frequencies (around 400 MHz) reach deeper but resolve less detail, while higher frequencies (around 2,500 MHz) give fine resolution at shallow depth.
Stepped-Frequency Continuous-Wave (SFCW) radar. Instead of a single pulse, SFCW systems sweep through a frequency range, typically 400 to 4,000 MHz. This improves the depth-versus-resolution compromise.
GPR data supports 3D reconstruction and augmented-reality-style surface projection of subsurface features. One example: an Alabama hydroelectric spillway inspection used GPR screening followed by ultrasonic tomography to distinguish trapped water from honeycombing inside the structure [8].
Electromagnetic cover meters. These operate on the eddy-current principle. Good for cover-depth QC on individual bars within approximately 150 mm of the surface.
GPR’s limits are worth stating explicitly, especially against ultrasonic tomography. Signal attenuation increases rapidly beyond approximately 500 mm in typical reinforced concrete. In high-humidity or saturated concrete, water absorbs the electromagnetic signal, and chloride contamination makes it worse. GPR is strong for finding metal but poor at detecting concrete defects — it sees dielectric contrast, not acoustic impedance changes. Dry air voids, honeycombing, and delaminations are often invisible or ambiguous on GPR scans. Steel-fiber reinforced concrete blocks GPR almost completely.
Which is why GPR and ultrasonic tomography work better together than either does alone. In practice, GPR screens large areas fast and maps rebar layout, then ultrasonic tomography provides definitive defect sizing and characterization on the zones GPR flags. A segmental concrete highway bridge inspection in Florida used exactly this combination to detect grouting defects inside post-tensioning ducts, and most serious inspection programs use both methods [9].
7. Electrochemical Diagnostics for Rebar Corrosion
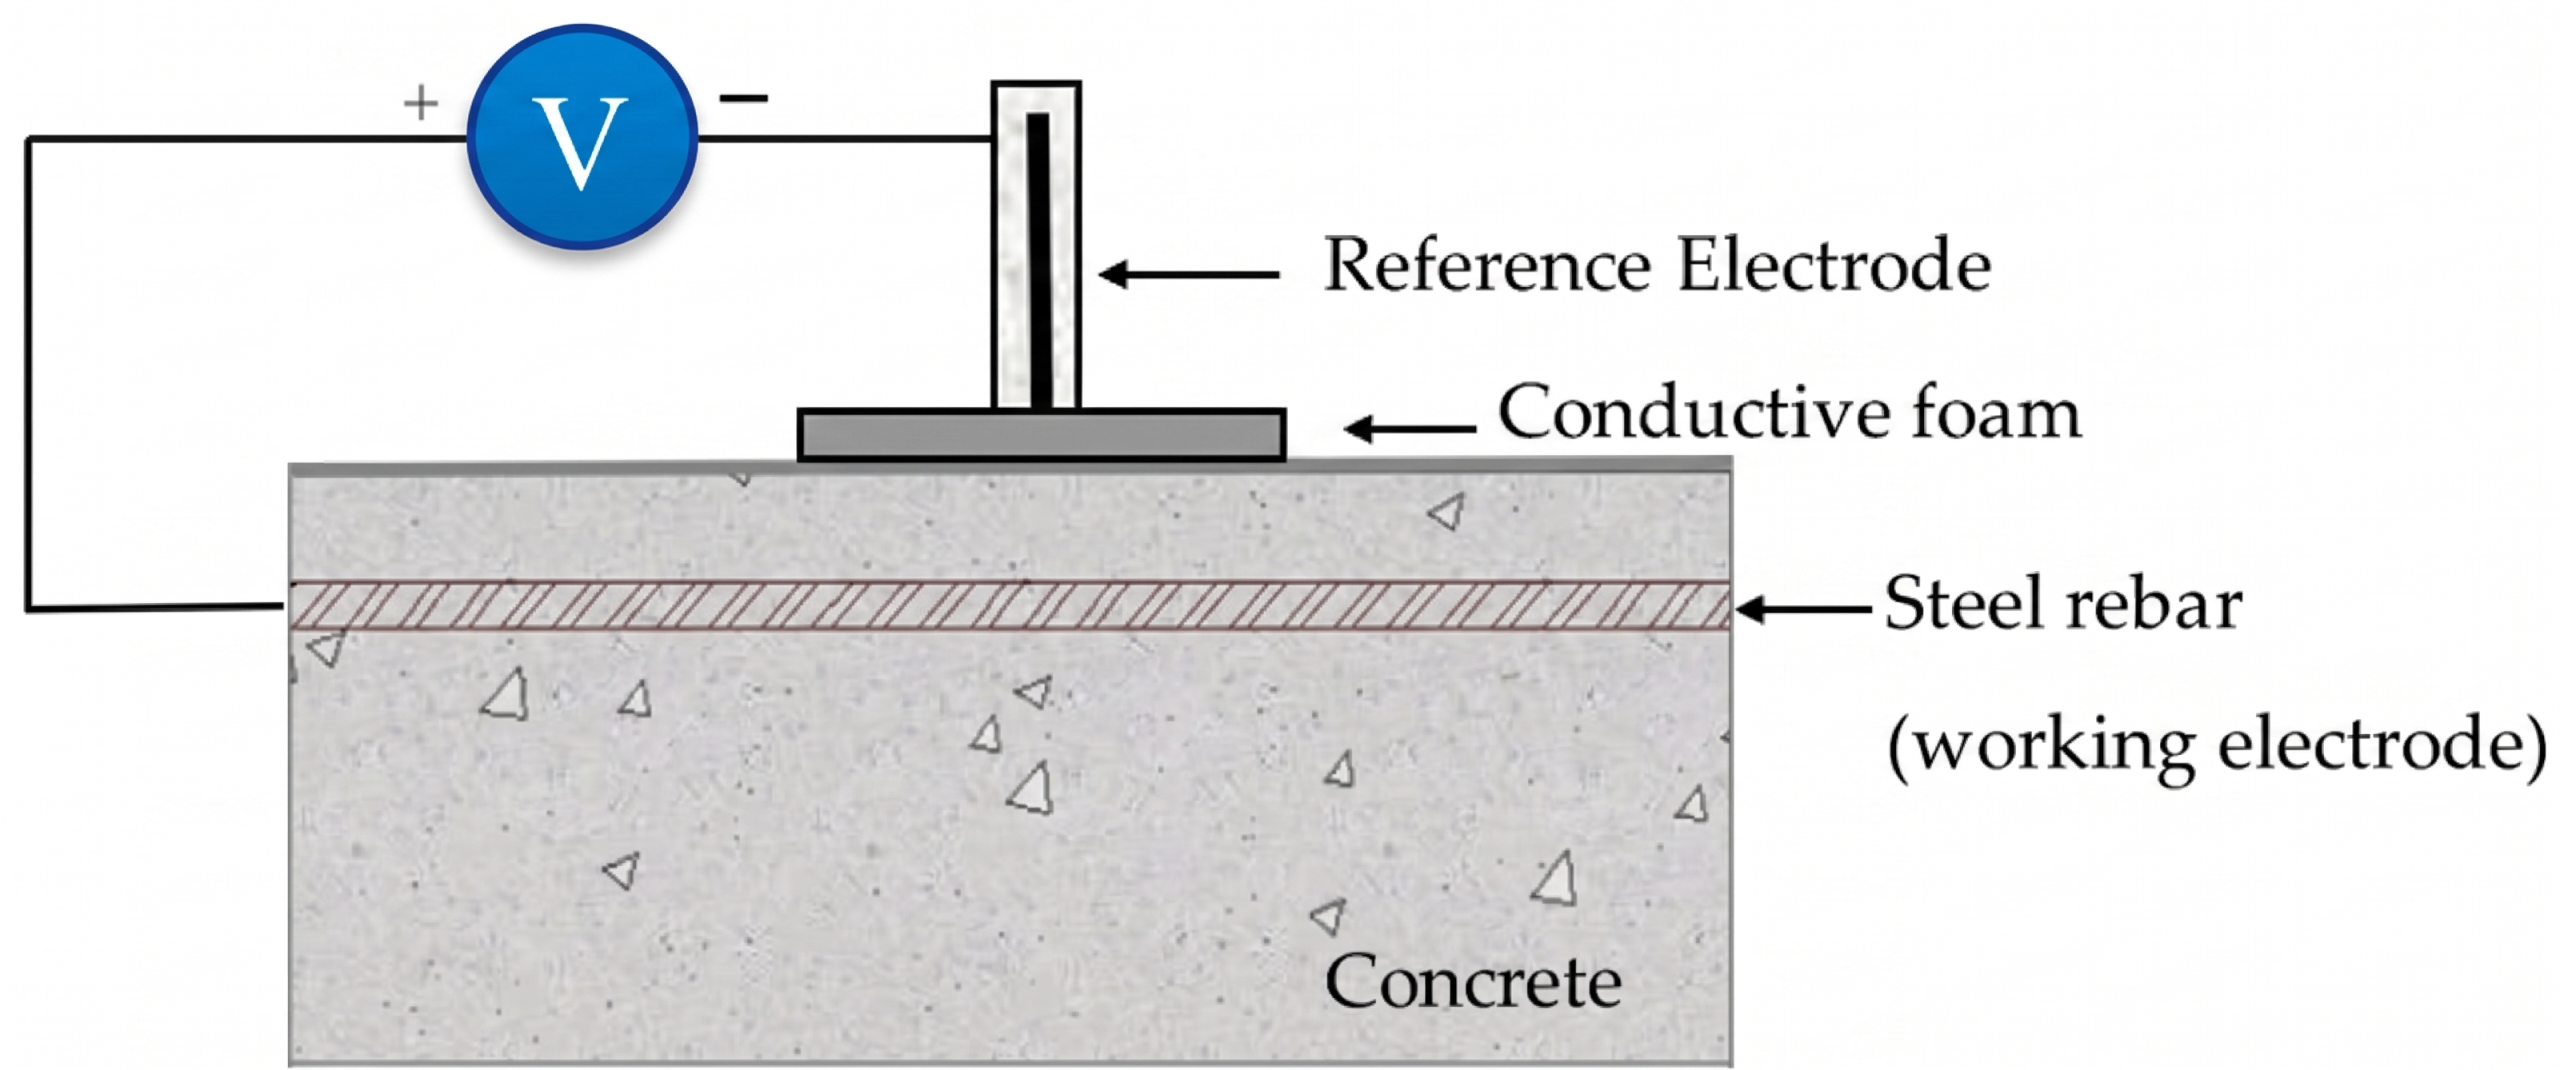
Corrosion is the number-one degradation mechanism in reinforced concrete worldwide. Carbonation lowers pH. Chlorides destroy the passive film on the steel surface. Rust expands two to six times the original steel volume depending on the corrosion product, generating internal pressure that eventually cracks and spalls the cover.
Half-cell potential mapping. Measures the thermodynamic probability that rebar corrosion is active at each test point. Well-known and widely used. Traditional setups require drilling through the cover and wiring directly to the rebar.
Surface resistivity (Wenner array). Measures the corrosion kinetics, not just the probability. Low resistivity means the concrete provides an easy path for ionic current, which accelerates the corrosion rate.
Connectionless pulse-response devices. Measure corrosion rate, potential, and resistivity simultaneously without drilling. This matters on nuclear structures, post-tensioned bridges, and any asset where penetrating the cover is prohibited.
Probability plus kinetics tells the full story. Half-cell potential alone tells you corrosion might be happening. Resistivity alone tells you the conditions favor it. You need both to make a sound maintenance decision.
8. Radiographic, Thermal, and Acoustic Emission
Several other NDT families address specific diagnostic questions that ultrasonics and radar do not cover well. None of them replaces the methods above, but each fills a gap worth knowing about.
Radiographic testing. Isotopic sources (cobalt-60 or iridium-192) or linear accelerators transmit radiation through concrete, producing shadow images of internal features. The images are unambiguous and provide excellent defect visualization. The trade-off is operational: radiation permits, licensed operators, and exclusion zones make radiography impractical for routine field work.
Infrared thermography. Thermal cameras scan large areas quickly, detecting shallow delaminations and moisture intrusion through surface temperature differences. Depth is limited to approximately 100 to 125 mm. Sun, wind, and surface condition variation generate false positives, so anomalies typically need confirmation by tomography or Impact-Echo.
Acoustic emission. A passive technique that listens for the stress waves generated by active cracking. Sensors triangulate the source location in real time. Valuable for long-term structural health monitoring of bridges and containment structures, but not practical for one-off inspections since it requires sustained loading or environmental cycling to produce signals.
9. Choosing the Right Method
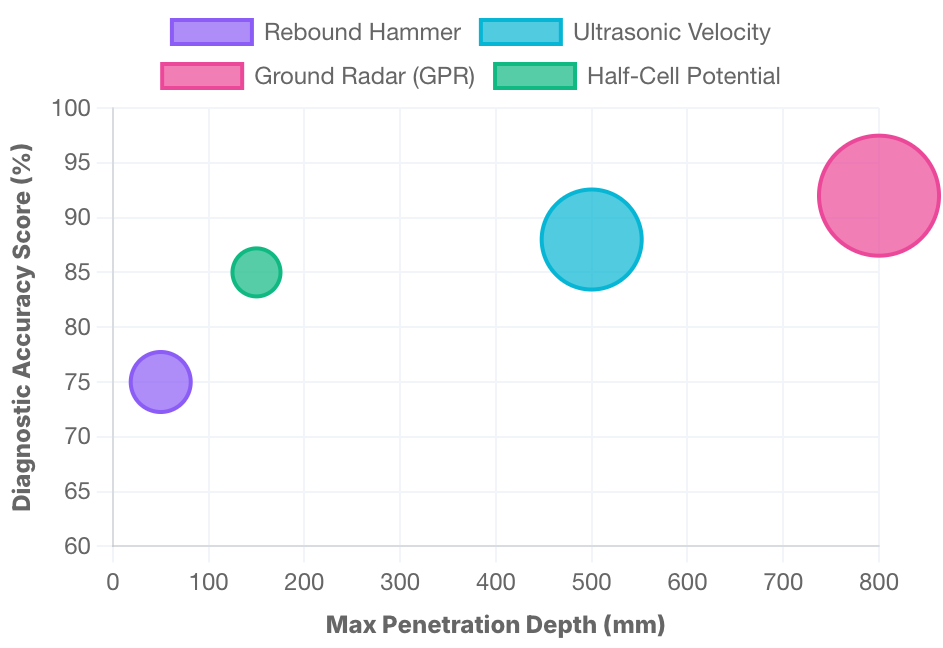
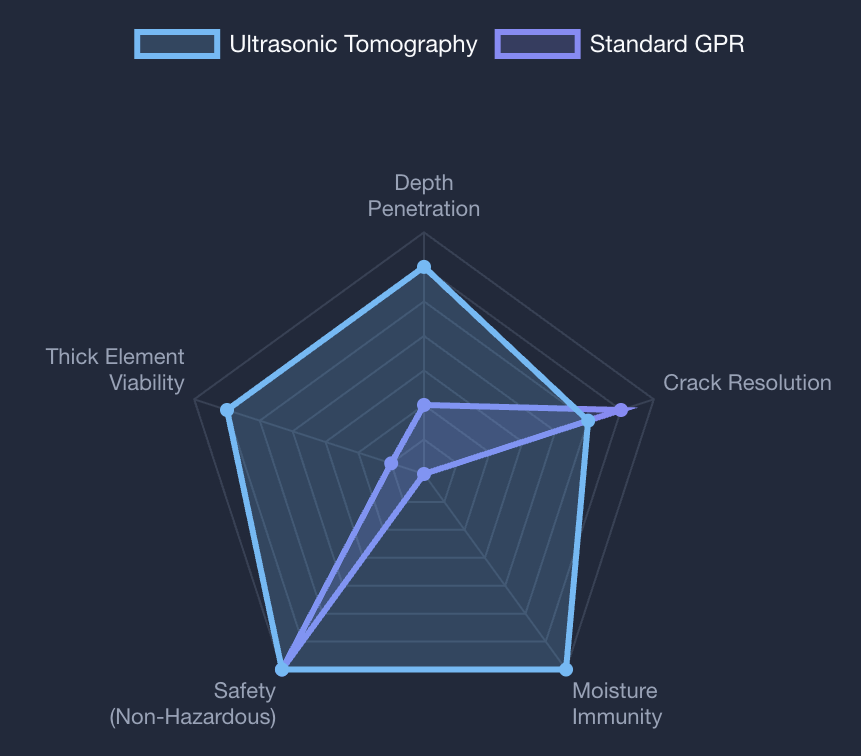
Picking the right NDT approach comes down to a few practical questions about the job in front of you.
How many faces can you access? If you only have one side, through-transmission UPVT is off the table. That leaves Impact-Echo, ultrasonic tomography, or GPR. Most field situations today are single-sided.
What are you looking for? Rebar layout and conduit locations point to GPR as a starting point. Voids, delaminations, thickness, PT duct grouting defects point to ultrasonic tomography. Targeted thickness gauging, anchor and bolt inspection, or confirming a single reflector at a known location is pulse-echo territory. Concrete quality and uniformity screening is UPVT territory. Corrosion state calls for half-cell potential plus resistivity.
What is the material condition? Saturated or chloride-loaded concrete kills GPR performance. Dense dual-mat rebar creates acoustic shadow zones for ultrasonic tomography. Carbonated surfaces skew rebound hammer readings. Every method has a material condition that degrades it.
How deep do you need to go? Shallow targets under 150 mm: cover meters and IR thermography. Medium range, 150 to 500 mm: GPR, Impact-Echo, and ultrasonic tomography all work. Deep targets from 500 mm to 4+ m: ultrasonic tomography is the only volumetric option.
What is your area and time budget? Large bridge decks and parking structures call for GPR and robotic scanning platforms for rapid screening [10]. Forensic hotspots and deep structures call for ultrasonic tomography to get definitive answers.
The most reliable inspection programs combine methods: GPR for spatial orientation, ultrasonic tomography for definitive defect sizing, and electrochemical techniques for corrosion rate assessment. No single instrument closes every question.
10. Equipment Categories and What Differentiates a Serious Ultrasonic Tomography System
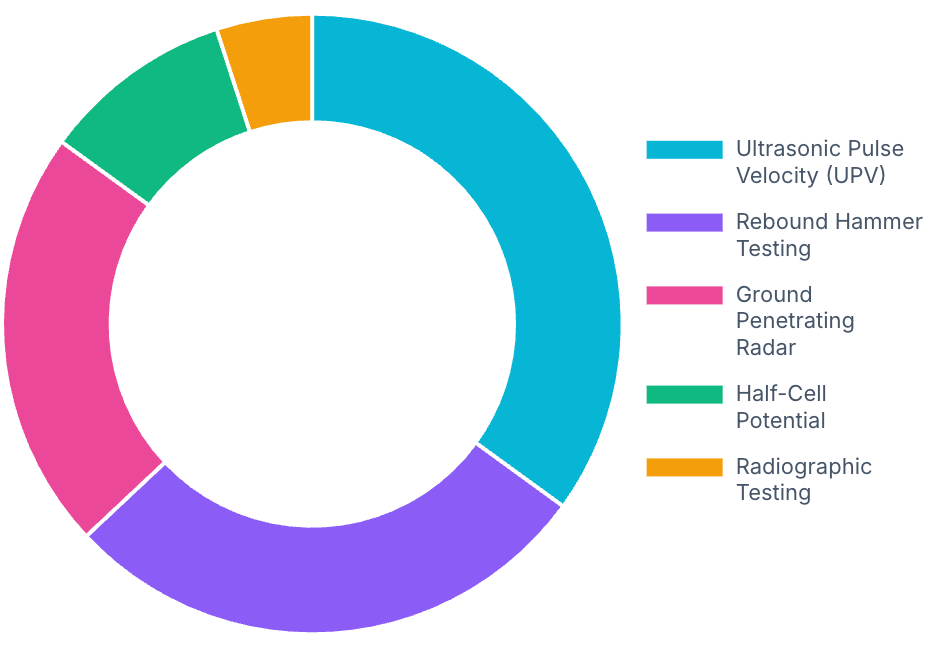
Category 1 — Surface-hardness instruments. Rebound hammers with digital logging and velocity-based readings. Simple, fast, limited to the surface layer.
Category 2 — Single-channel ultrasonic (UPVT and pulse-echo). One-channel ultrasonic tools: UPVT for transit-time velocity measurement and pulse-echo for time-of-flight reflector location. Wireless data capture and grid-scan modes are standard on current instruments.
Category 3 — Multi-channel ultrasonic tomography arrays. The state of the art for volumetric concrete imaging. What separates a professional system from a basic one: acoustic frequency range (20 to 100 kHz), number of DPC elements in the base aperture, whether the architecture supports aperture extension (coupling multiple array heads into one synchronized matrix), penetration depth (professional systems reach 2 m, deep configurations reach 4+ m), and the reconstruction pipeline (FMC/TFM for true 3D imaging).
Category 4 — Electromagnetic instruments. Cover meters, pulsed GPR, and stepped-frequency GPR. Good for finding metal and mapping rebar layout. Limited at depth, poor in wet conditions, and poor for detecting concrete defects. Key differentiators: antenna bandwidth, 3D reconstruction capability, and data export flexibility.
Category 5 — Electrochemical instruments. Drill-to-rebar half-cell systems versus connectionless pulse-response devices. Key differentiators: whether they require a direct rebar connection, whether they measure corrosion rate simultaneously, and whether they support grid-mapping for spatial coverage.
The buying logic is straightforward: match the physics envelope to the structures you inspect. Depth, defect type, and access conditions drive the choice. Our ultrasonic concrete testing instruments span the three ultrasonic categories above — from couplant-free UPVT screening through single-channel pulse-echo to multi-channel FMC/TFM tomography.
11. Key Takeaways
Multi-modal inspection is the default. No single method covers the full defect spectrum, and the strongest programs combine several approaches — GPR for layout, ultrasonic tomography for volumetric imaging, electrochemical for corrosion.
Single-sided access is the new normal. Most field conditions limit you to one face. That constraint should drive method selection from the start.
Ultrasonic tomography has moved from specialist tool to mainstream. FMC/TFM architecture, DPC transducers, and aperture-scaling designs have made single-sided, 3D concrete imaging practical and repeatable across a wide range of structures and depths.
UPVT and ultrasonic tomography complement each other. Velocity tells you something is wrong in a zone. Tomography shows you what it is and exactly where it sits.
Corrosion assessment needs both halves. Thermodynamics (half-cell potential) tells you whether corrosion is active. Kinetics (resistivity) tells you how fast it is progressing. One without the other gives you an incomplete picture.
Closing
Velocity screening and volumetric imaging answer different questions — and a serious inspection program needs access to all of them. That is why Delta Test Technologies covers the full ultrasonic range: single-channel UPVT tools for fast quality screening, single-sided pulse-echo flaw detectors for thickness and reflector measurement, and multi-channel FMC/TFM tomography platforms for volumetric imaging from a single surface.
Ultrasonic NDT of concrete is the core of what Delta Test Technologies does. Our specialists support the DPC transducer architecture, the FMC/TFM reconstruction pipeline, and the validation procedures — including the 5 m reference block testing at the BAM facility in Horstwalde — referenced throughout this guide. The recommendations and method descriptions you read here are the same ones our team gives to bridge owners, dam operators, and inspection contractors in the field.
Need Help Choosing the Right Technology?
If you are evaluating which technology fits your inspection program, the Delta Test Technologies engineering team is happy to talk it through. Browse the ultrasonic concrete testing range to compare instruments by method, depth reach, and application.
References
[1] Bulavinov, A., Pinchuk, R., Samokrutov, A., Shevaldykin, V. “Advanced tomographic imaging techniques for quality assessment of concrete structures by means of ultrasound.” NDE NucCon 2023, International Conference on Non-destructive Evaluation of Concrete in Nuclear Applications, Espoo, Finland, January 2023.
[2] Bulavinov, A., Pinchuk, R., Samokrutov, A., Shevaldykin, V. “New trends in the ultrasonic imaging of concrete structures by means of 3D-FMC technology.” ACS-Solutions GmbH, Saarbrucken, Germany.
[3] Kozlov, V.N., Samokrutov, A.A., Shevaldykin, V.G. “Thickness measurements and flaw detection in concrete using ultrasonic echo method.” Nondestructive Testing and Evaluation, 13(2): 73–84, 1997.
[4] Bishko, A.V., Samokrutov, A.A., Shevaldykin, V.G. “Ultrasonic echo-pulse tomography of concrete using shear waves low-frequency phased antenna arrays.” Proceedings of the 17th World Conference on Non-destructive Testing, Shanghai, China, 2008.
[5] Haza, A.O., Petersen, C.G., Samokrutov, A. “Three-Dimensional Imaging of Concrete Structures Using Ultrasonic Shear Waves.” German Instruments SA, Denmark, 2011.
[6] Shevaldykin, V.G., Samokrutov, A.A., Kozlov, V.N. “Ultrasonic low-frequency short-pulse transducers with dry point contact. Development and application.” International Symposium on Non-Destructive Testing in Civil Engineering (NDT-CE), Berlin, 2003.
[7] Bungey, J.H., Millard, S.G., Grantham, M.G. Testing of Concrete in Structures, 4th ed. Taylor & Francis, 2006.
[8] Bigman, D.P. “Ground penetrating radar inspection of a large concrete spillway: A case study using SFCW GPR at a hydroelectric dam.” Case Studies in Construction Materials, Vol. 16, 2022.
[9] Federal Highway Administration (FHWA). “Identifying Potential Damage to PT Ducts.” Long-Term Bridge Performance Program, U.S. Department of Transportation.
[10] Gucunski, N. et al. “Robotic Platform RABIT for Condition Assessment of Concrete Bridge Decks Using Multiple NDE Technologies.” FHWA-HRT-13-035, January 2013.